1Module overview
The module Industrial Risk in Polyodos covers the entire industrial-risk analysis lifecycle, from context description to Word-report export.
Typical workflow
2Create an Industrial Risk project
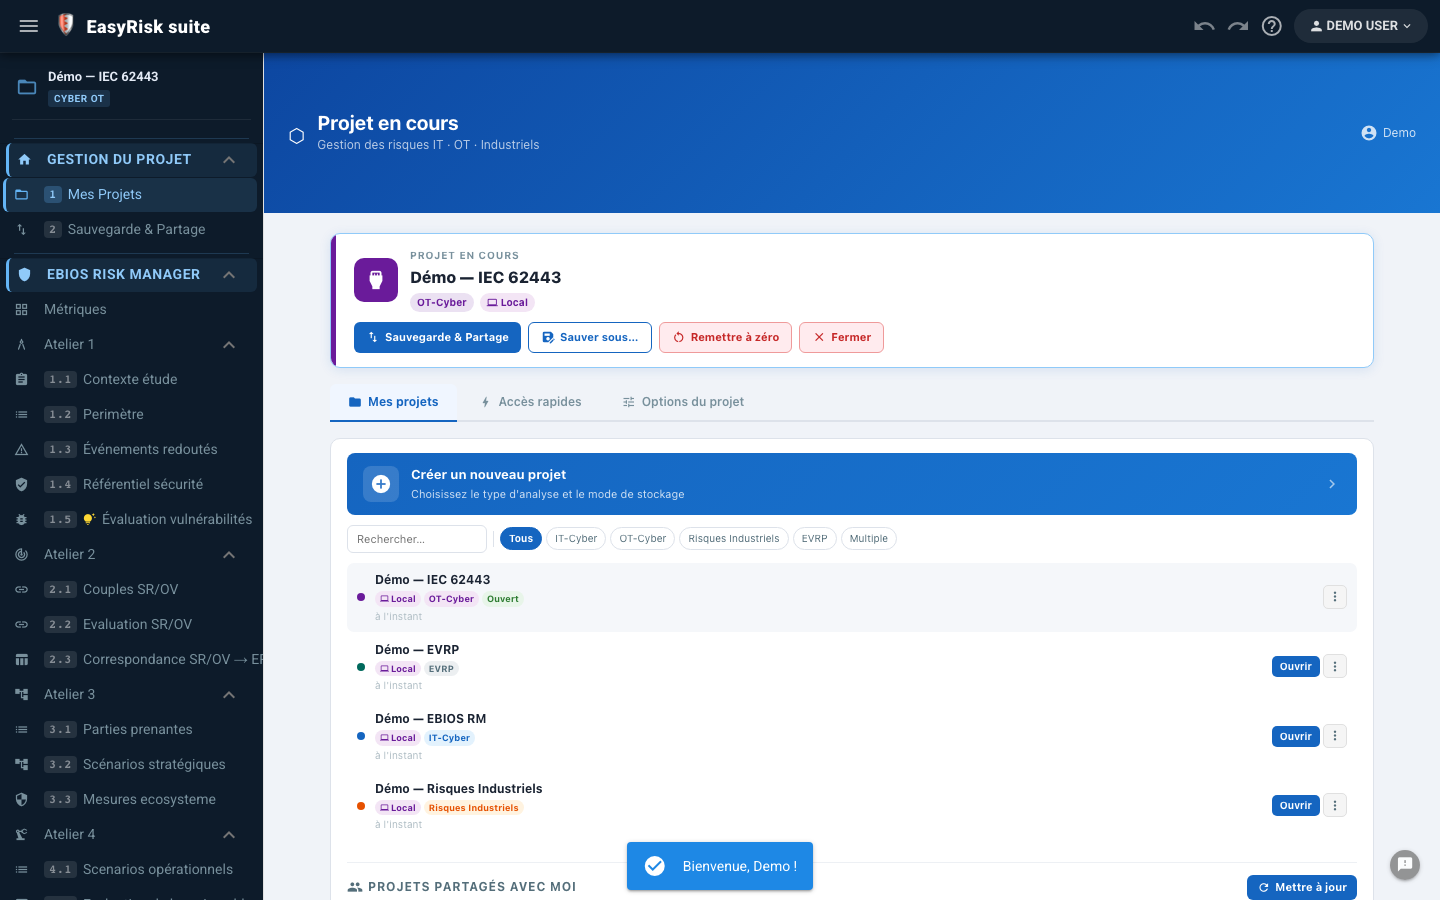
From the home page, click New project. Enter a name and select the project type.
| Project type | Modules inclus |
|---|---|
| Industrial Risk | PHA, FMEA, HAZOP, LOPA, Bow-Tie, FTA, and Industrial Risk Report |
| Multi-modules | Industrial Risk + EBIOS RM in one cyber-physical project |
3Assessment context
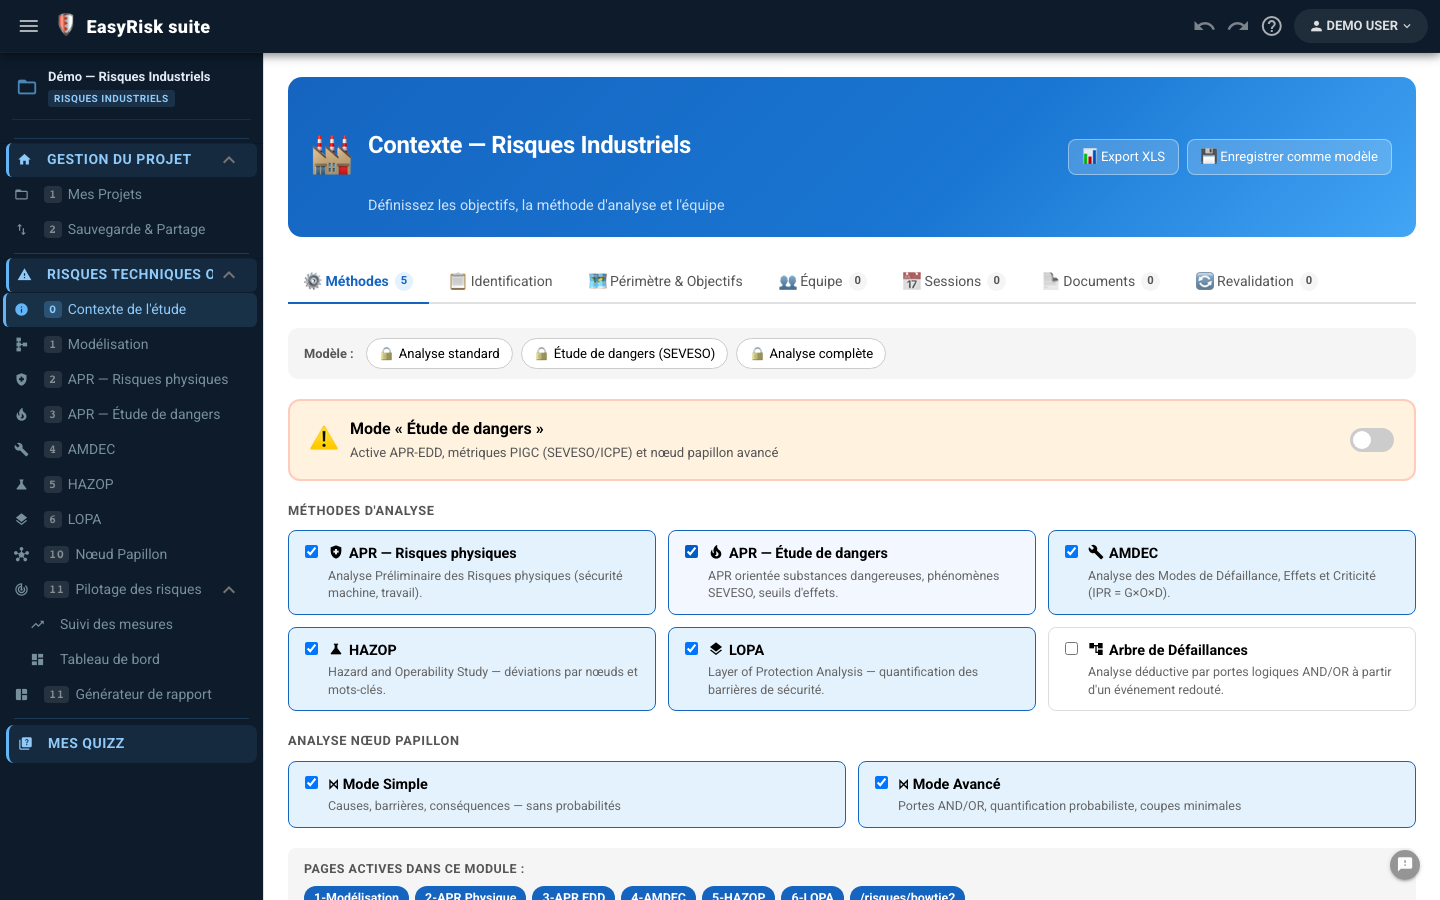
The Context is the required starting point. It defines study metadata and methods to use.
Information to enter
| Field | Description |
|---|---|
| Study title | Study identifier (appears in the report) |
| Facility | Name and description of the analysed facility |
| Organisme / Responsable | Organisation and person responsible for the study |
| Reference / Version | Document identifier and revision number |
| Dates | Analysis period |
| Functional scope | Systems and equipment included in the analysis |
| Geographical scope | Physical area covered by the study |
| Exclusions | Anything explicitly outside the scope |
| Regulations | Textes applicables (ICPE, SEVESO, directive ATEX…) |
| Team members | Analysis participants (function + role) |
Select methods
Select only the methods you want to use. Only corresponding pages will appear in the navigation menu.
4Model the facility
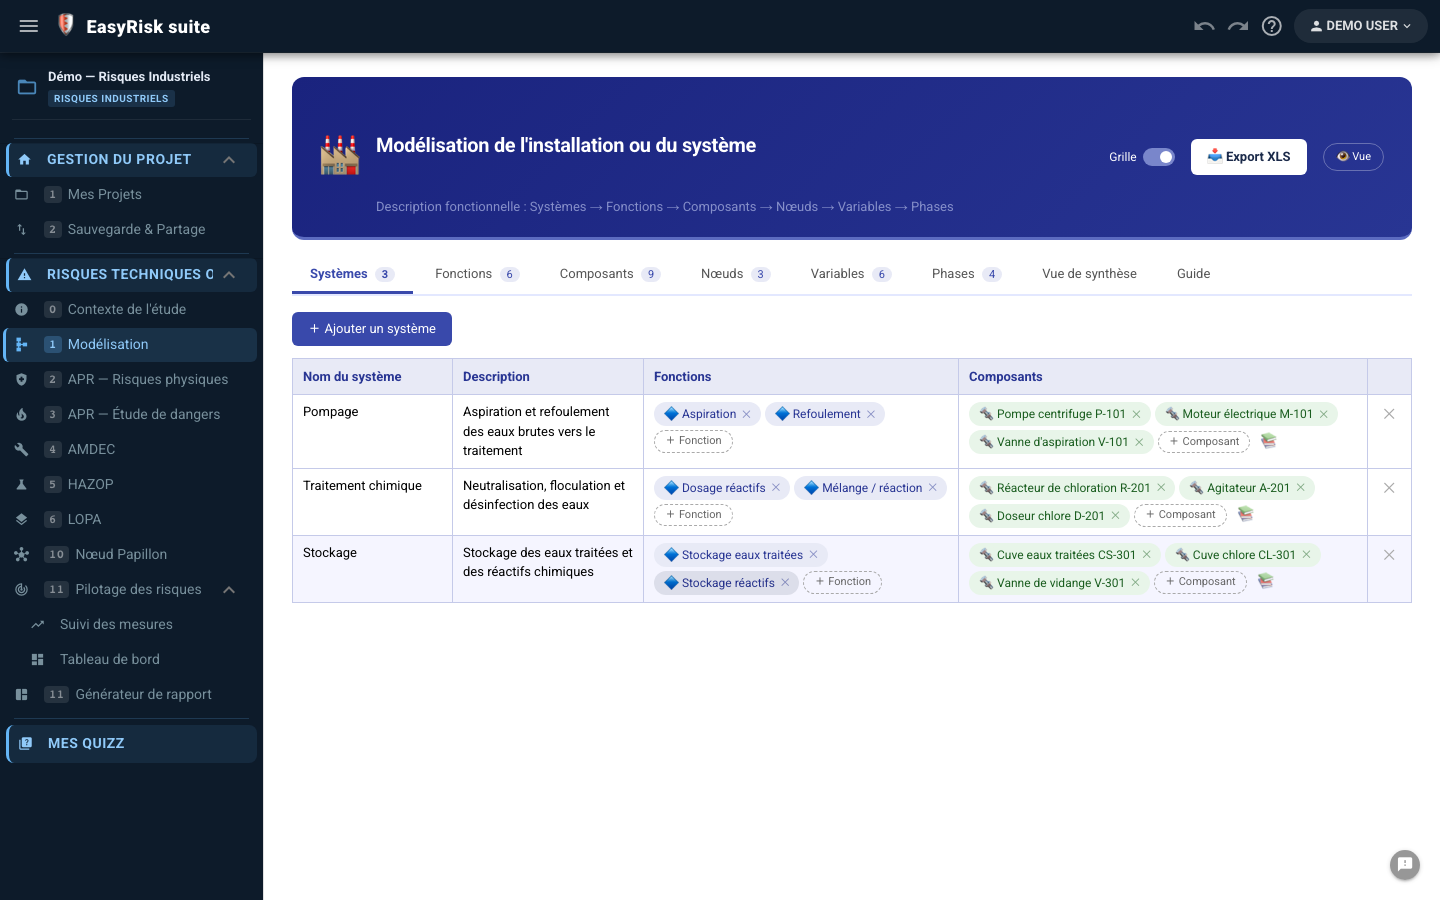
Modelling structures the facility into a three-level hierarchy: systems → components → functions. This structure is reused across analysis pages to link every scenario to specific equipment.
Hierarchy
| Level | Example | Role in the analysis |
|---|---|---|
| System | Main reactor, Utilities, H₂SO₄ Storage | Groups related components; filters in PHA, FMEA, and HAZOP |
| Component | Pump P-101, Valve V-204, Heat exchanger E-301 | Equipment targeted by FMEA failure modes |
| Function | Transfer, Regulate pressure, Measure flow | Function performed by the component |
Add elements
- Click + Add a system —enter a name and short description
- Select the created system, then click + Composant to attach equipment
- For each component, add one or more functions
- Repeat for each subsystem in your facility
5PHA—Preliminary Hazard Analysis
Polyodos provides two PHA variants based on your facility's regulatory context:
| Variant | Use | Rating grids |
|---|---|---|
| Physical-Risk PHA | General facility-hazard analysis | Severity / Likelihood configurable in Metrics |
| Safety-report PHA | ICPE and SEVESO facilities—hazardous phenomena | Fixed regulatory PIGC grids |
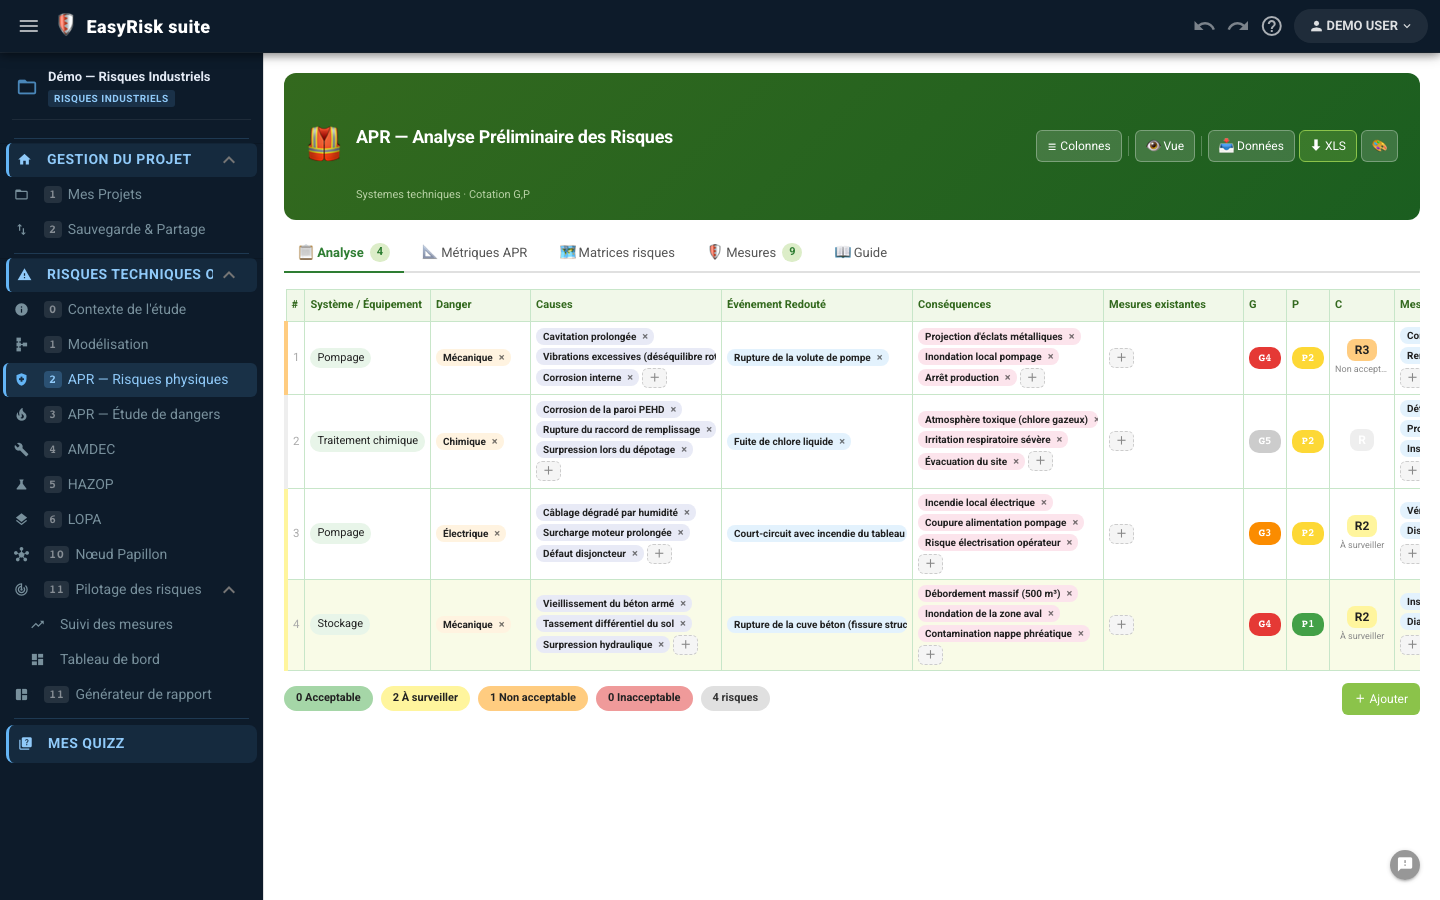
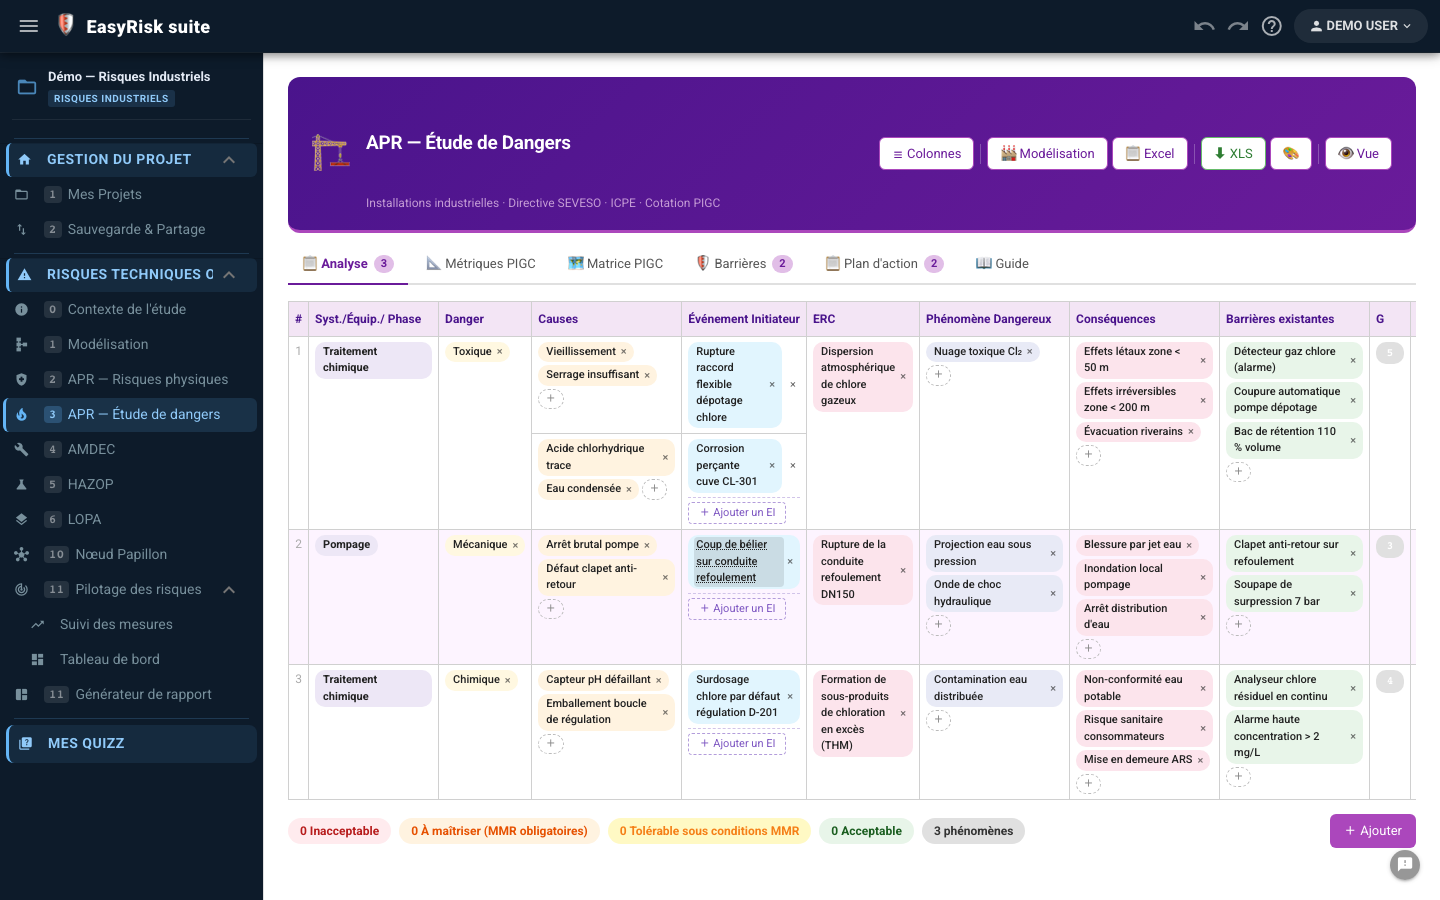
Physical-Risk PHA columns
| Colonne | Description |
|---|---|
| System / Equipment | Selection from the model |
| Hazard | Hazard source (fire, explosion, fall, leak, etc.) |
| Hazardous event | Direct consequence of the hazard |
| Causes | Origins that may trigger the event |
| Consequences | Impacts on people, environment, and property |
| Inherent S / L | Severity and likelihood without measures |
| Preventive measures | Existing or planned barriers |
| Residual S / L | Rating after measures—residual risk level |
| Statut | Acceptable / Monitor / Unacceptable / Critical |
Enter a scenario
- Click + Add a row at the bottom of the table
- Select the system andequipment involved
- Enter the hazard, hazardous event, causes, and consequences
- Assign inherent S and L ratings—the criticality cell is coloured automatically
- Enter preventive measures and residual ratings
6FMEA—Failure Modes, Effects and Criticality Analysis
FMEA identifies failure modes for each component, evaluates criticality through theRPN (Risk Priority Number = Severity × Occurrence × Detectability), and defines corrective actions.
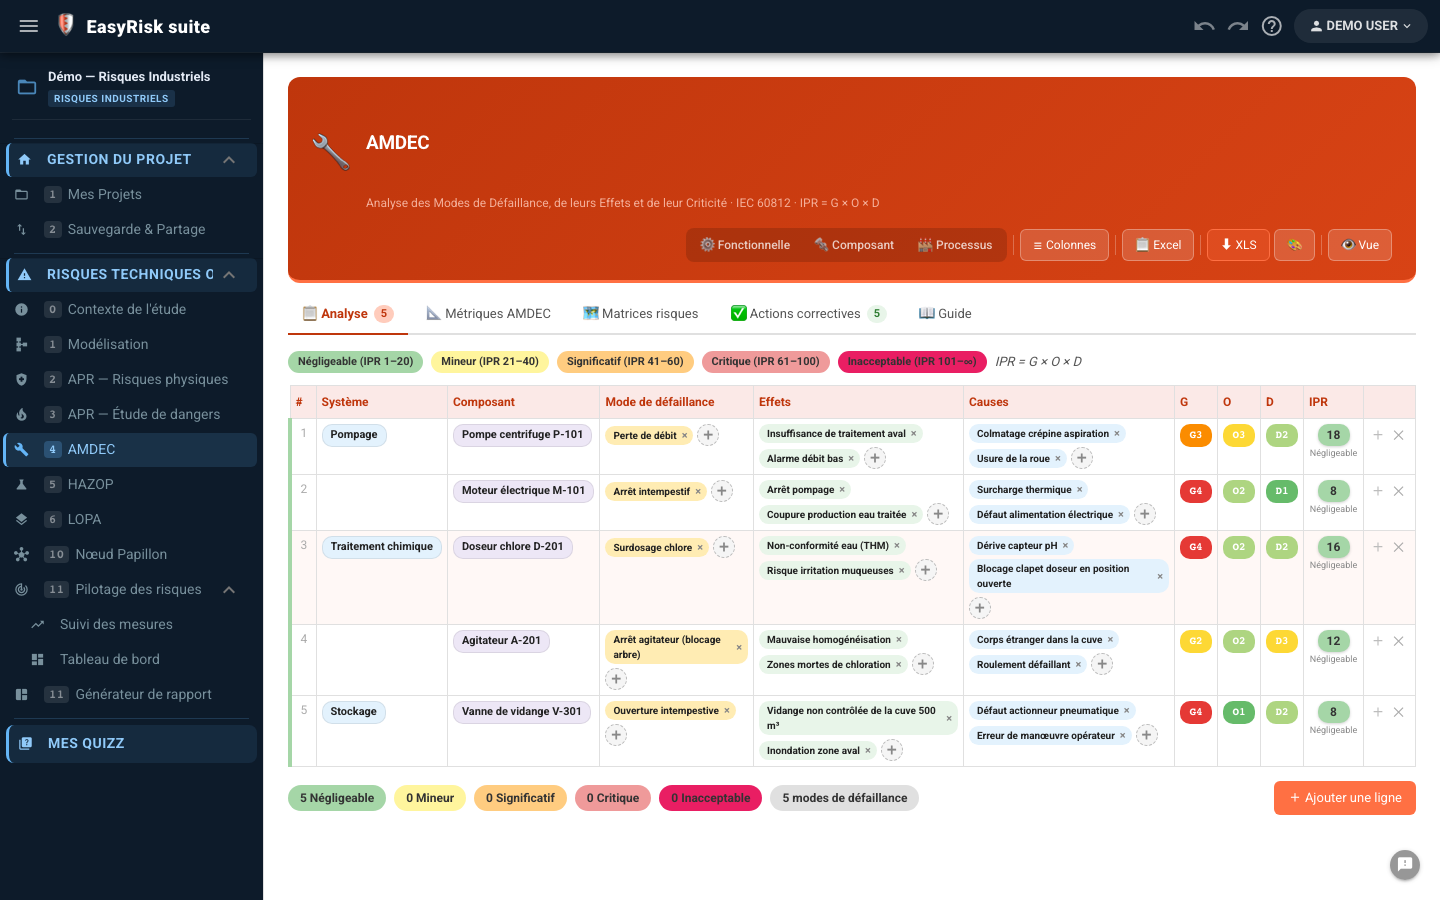
Colonnes AMDEC
| Colonne | Description |
|---|---|
| System / Component / Function | Taken from the facility model |
| Failure mode | How the component can fail (e.g. leak, blockage, drift) |
| Effets | Consequences for the system and people |
| Causes | Origins of the failure |
| G / O / D bruts | Severity, Occurrence, Detectability—initial RPN calculated automatically |
| Mesures correctives | Preventive actions, corrective actions, or improvements |
| Residual S / O / D | Ratings after measures—residual RPN |
Filter and sort
Use the column-header filters to quickly isolate critical failure modes or focus on a particular system. Sorting by decreasing RPN identifies action priorities in one click.
7HAZOP — Hazard and Operability Study
HAZOP analyzes process-parameter deviations from nominal conditions by combining guide words (No, More, Less, Reverse…) with parameters (flow, pressure, temperature, level…).
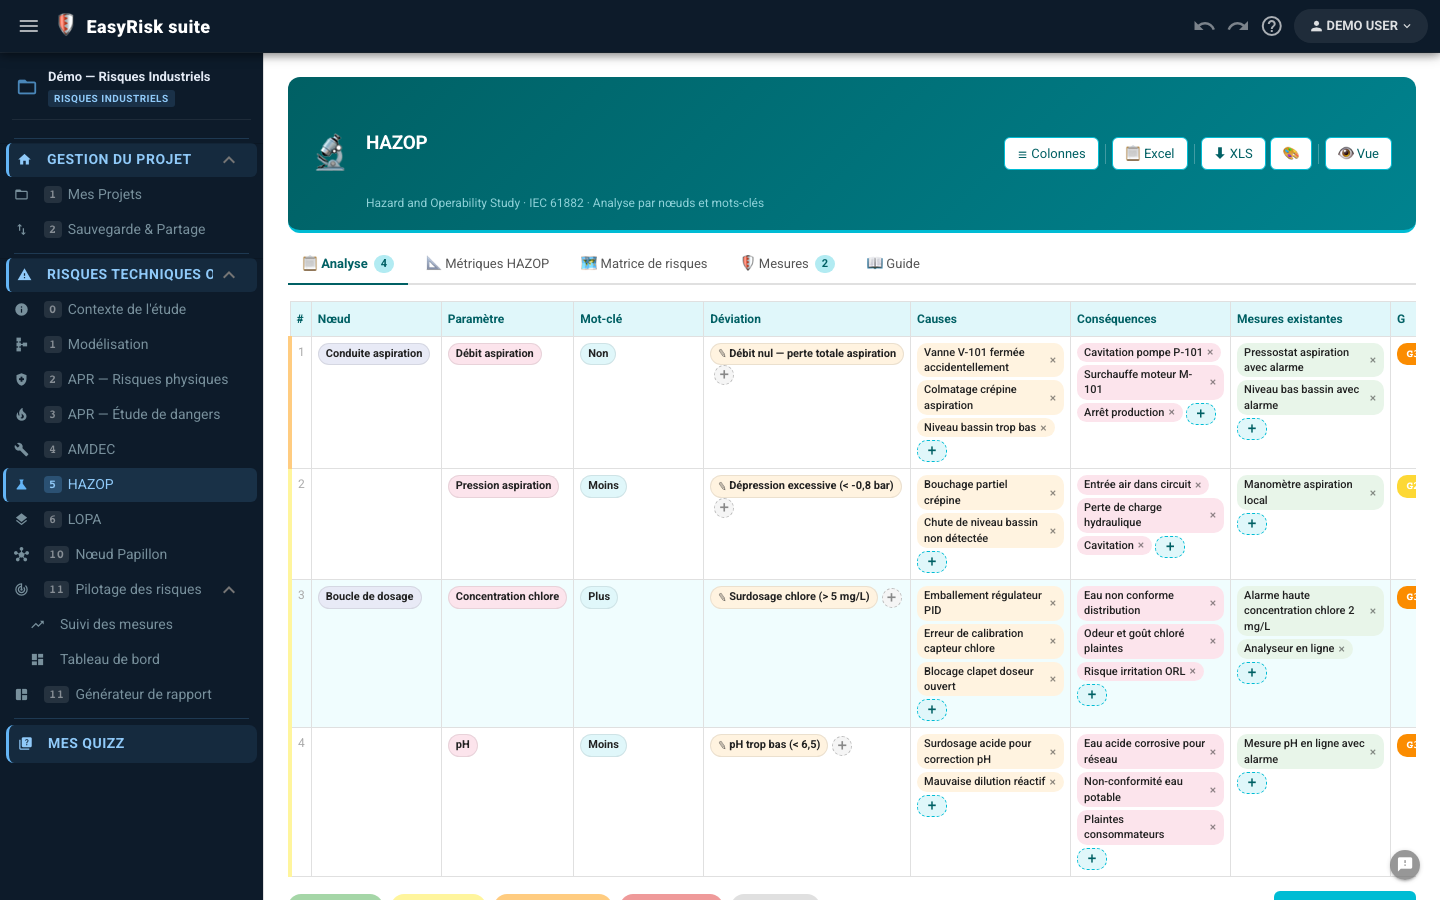
Colonnes HAZOP
| Colonne | Description |
|---|---|
| Node | Section or equipment analyzed (e.g. P-101 pump supply line) |
| Parameter | Process variable concerned (flow, pressure, temperature…) |
| Guide word | Type of deviation (No, More, Less, Other than…) |
| Deviation | Parameter + guide word combination (e.g. No flow) |
| Causes | Possible origins of the deviation |
| Consequences | Effects of the deviation if uncorrected |
| Mesures existantes | Existing safeguards |
| G / V | Deviation rating |
| Recommandations | Additional actions to implement |
8LOPA — Layer Of Protection Analysis
LOPA quantifies the frequency of hazardous events by accounting for independent protection layers (IPLs) and checks whether the residual risk is tolerable.
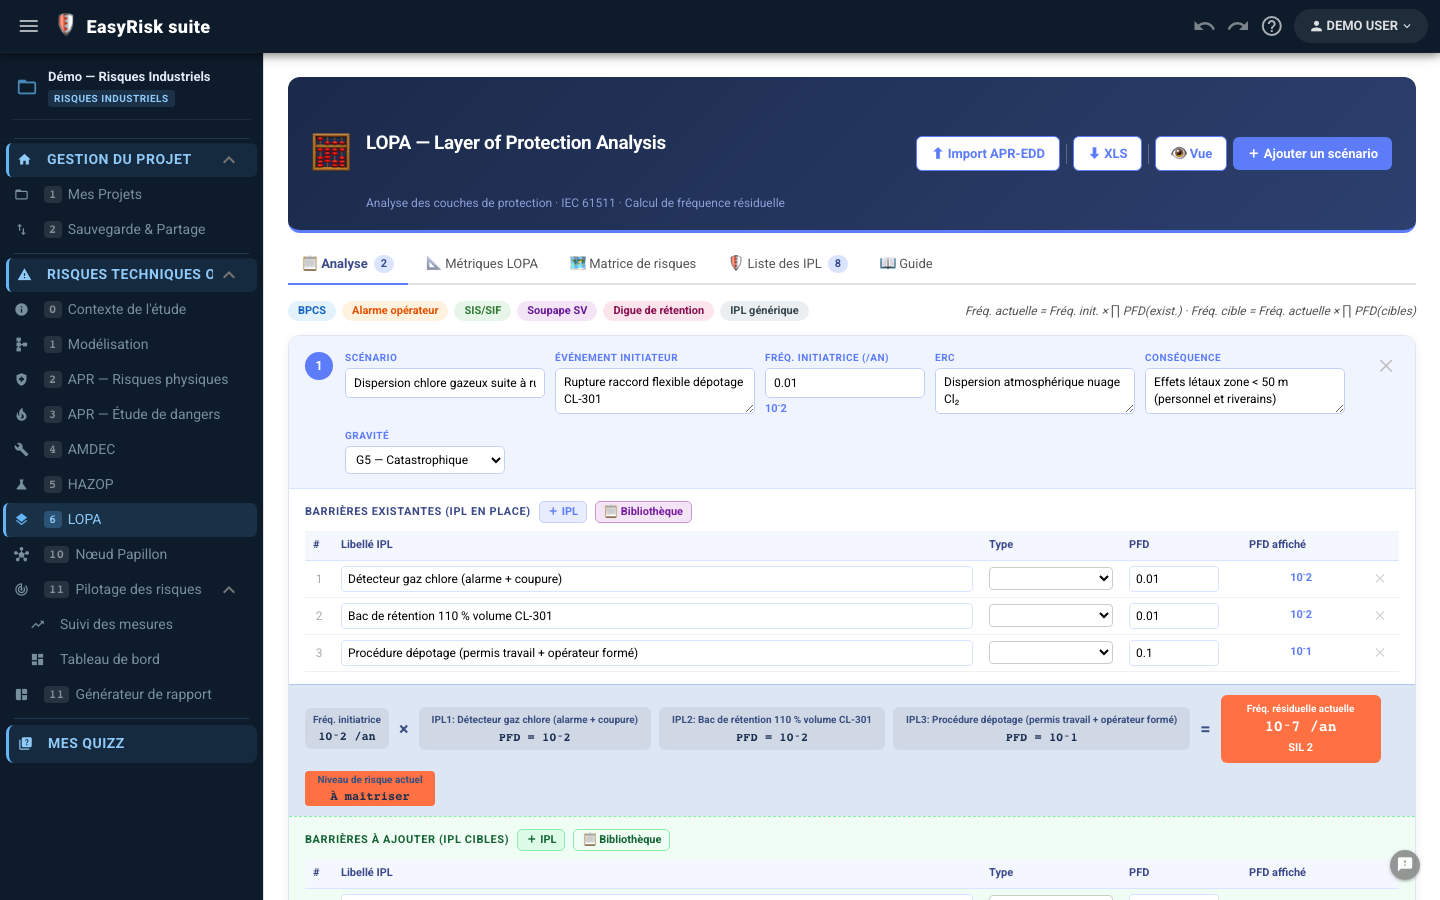
Colonnes LOPA
| Colonne | Description |
|---|---|
| Scenario | Description of the hazardous event analyzed |
| Initiating event | Triggering cause (e.g. power loss, operator error) |
| Initiating frequency (fi) | Initiator occurrence frequency (events/year) |
| ERC | Top event |
| Consequence / Severity | Impact and severity level of the top event |
| IPL | Independent protection layers with their PFD (Probability of Failure on Demand) |
| Residual frequency | fi × PFD(IPL1) × PFD(IPL2)…—calculated automatically |
Add IPLs
- In a LOPA row, click + IPL to add a protection layer
- Select the type IPL type (BPCS, SIS, relief valve, dike, procedure…)
- Enter the PFD (e.g. 0.1 for a SIL 1 SIS)
- The residual frequency is recalculated automatically after every change
9Bow-Tie
The bow-tie graphically represents a top event, with causes on the left and consequences on the right, showing prevention and protection barriers.
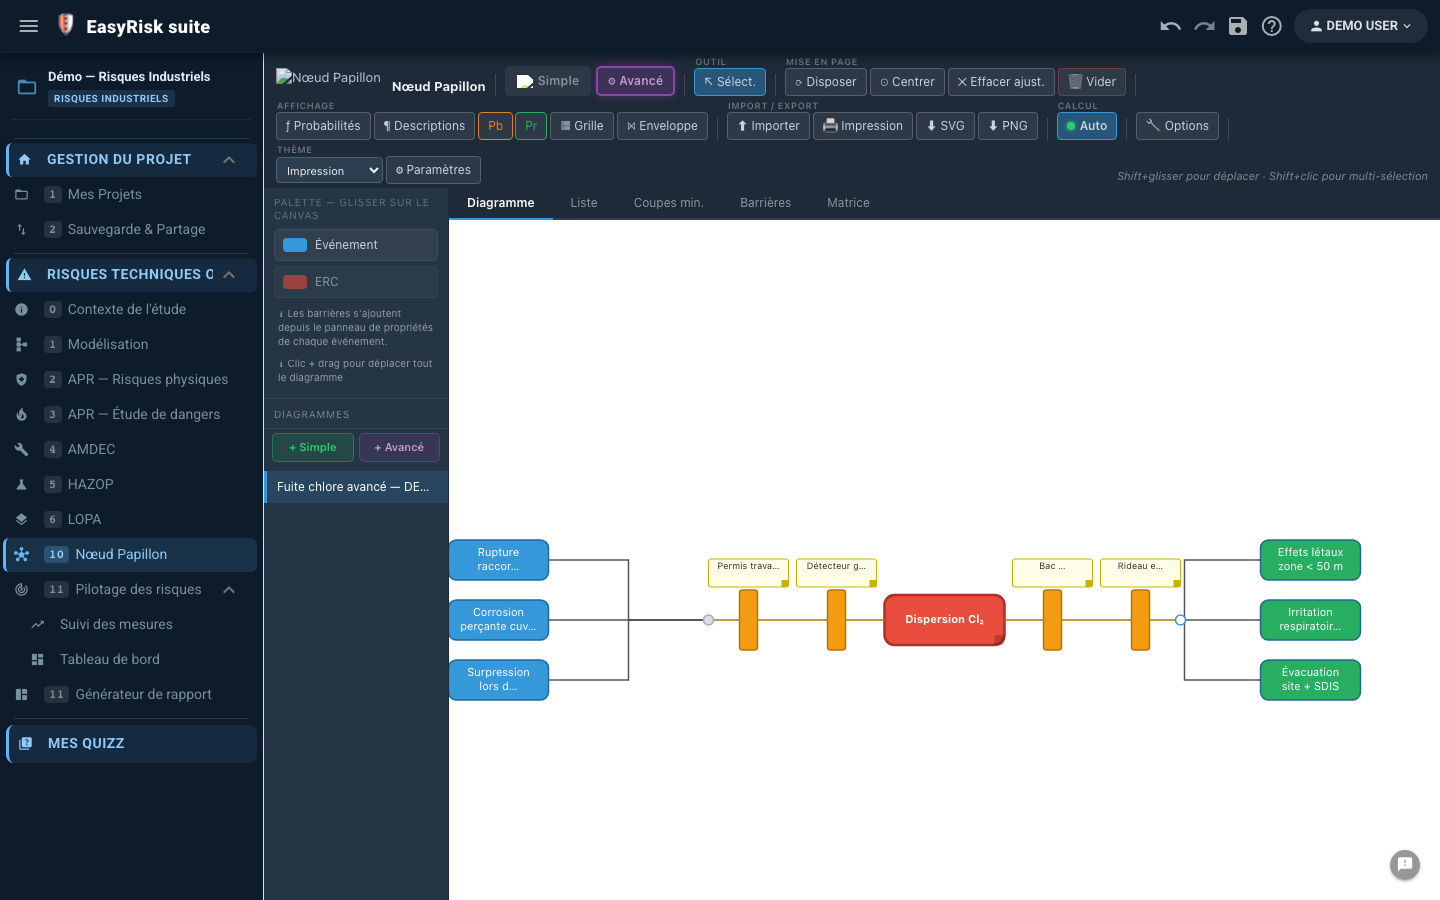
Two diagram modes
| Mode | Cas d'usage | Features |
|---|---|---|
| Simple | Communication, executive presentation | Visual bow-tie envelope, cause/consequence barriers, without probabilities |
| Advanced | Analyse quantitative, lien LOPA | AND/OR gates, conditions, probabilities, minimal cut sets (MOCUS), PHA/safety-report import |
Create a diagram
- In the side panel, click + Simple or + Advanced as required
- Name the diagram and define thetop event in the center
- Add the causes on the left (right-click the top-event node → Add a cause)
- Add the consequences on the right
- Place barriers on the links (click a link → Add a barrier)
10Metrics and risk matrix
The Metrics defines the rating scales (Severity, Likelihood) and criticality matrix used throughout the project analyses.
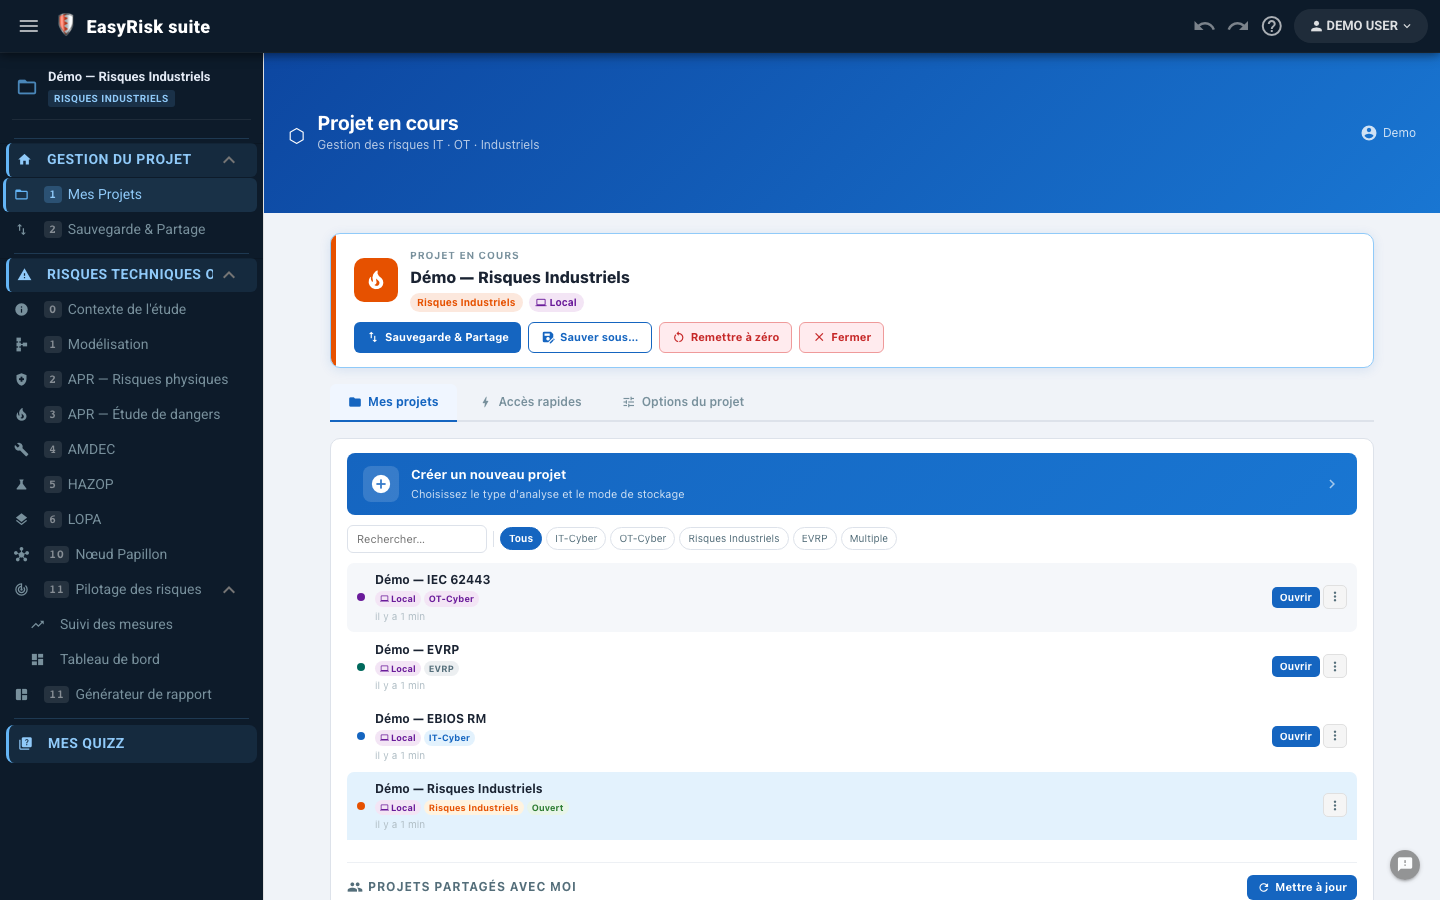
Configurable elements
| Element | Description |
|---|---|
| Severity levels | Number of levels (3 to 5), labels, and colors |
| Likelihood levels | Number of levels, labels, and reference frequencies |
| Criticality matrix | Color of each S×L cell (Acceptable / Monitor / Unacceptable / Critical) |
| Risk levels | Labels and FMEA RPN thresholds |
11Generate the report
Polyodos provides two complementary reporting pages:
| Page | Use |
|---|---|
| Report generator | Custom report by method (PHA, FMEA, HAZOP, LOPA, summary), with Markdown-editable sections |
| Industrial Risk report | Complete study report with all active methods and Word export |
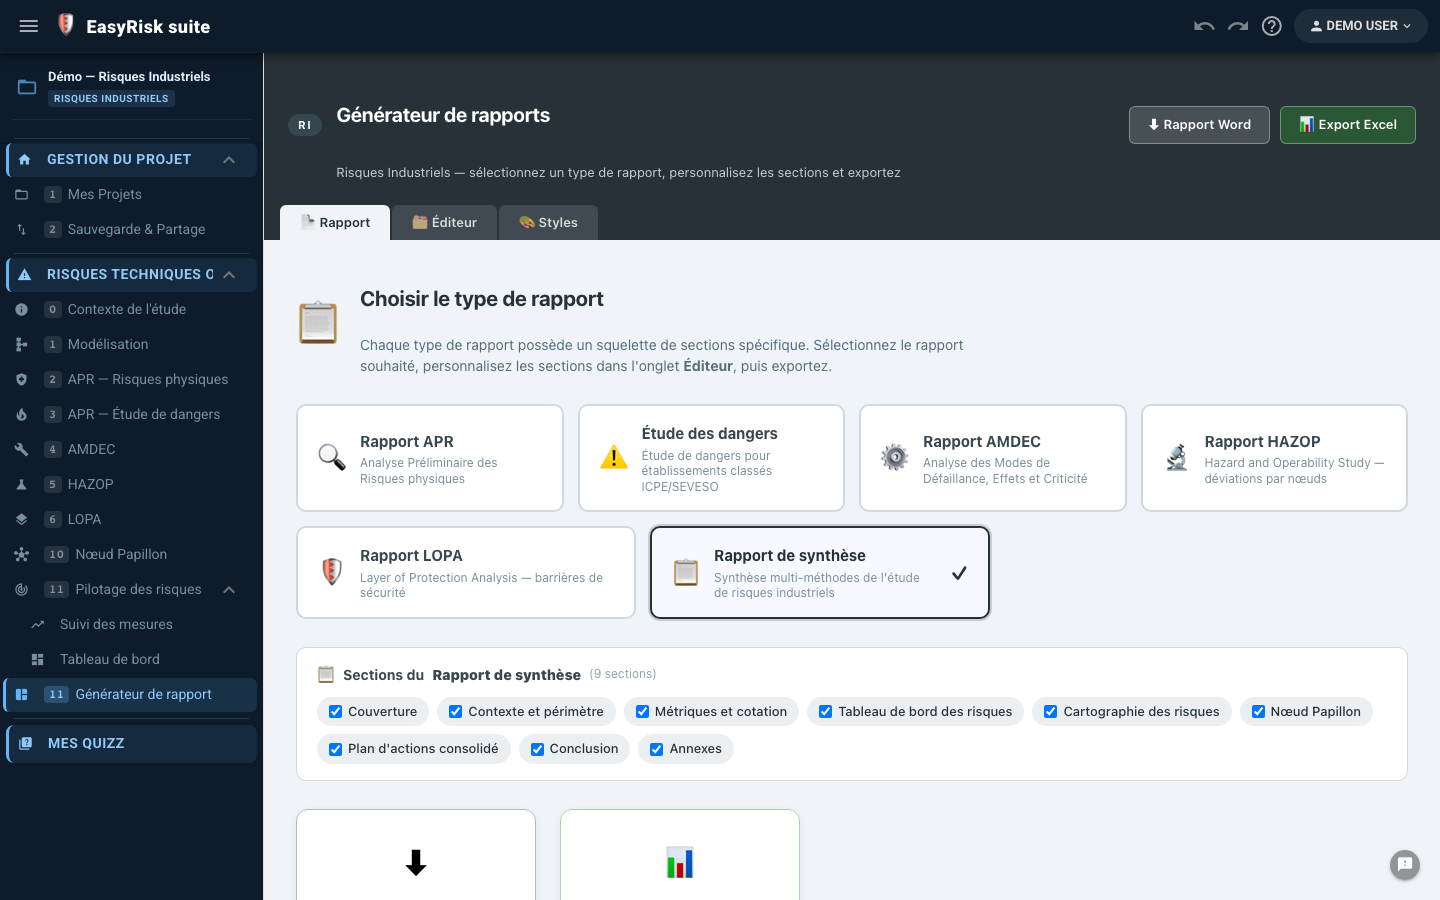
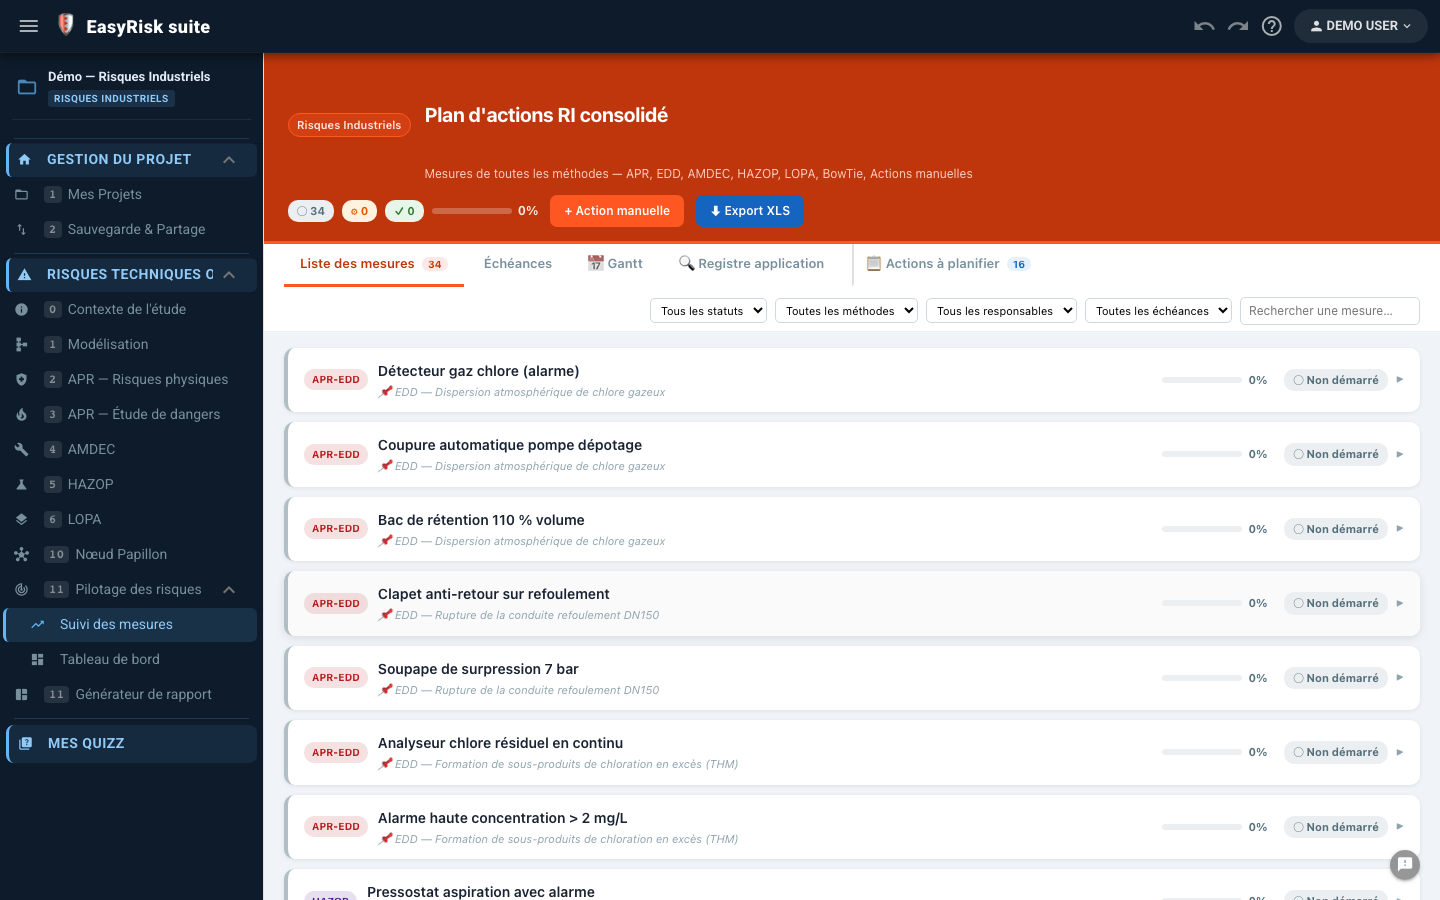
Generate the Word report
- Open the Industrial Risk report from the navigation menu
- Check the sections to include (context, tables, matrix…)
- Click ⬇ Exporter Word (.docx) —the file is generated directly in your browser
- The report is automatically named using the study title and date
Custom report generator
The generator creates tailored reports for each method. Each section contains Markdown text with variables automatically replaced by project data:
| Variable | Inserted value |
|---|---|
{titreEtude} | Study title (Context) |
{installation} | Facility name |
{nbScenariosAPR} | Total number of PHA scenarios |
{nbModesDefaillance} | Number of FMEA failure modes |
{nbDeviations} | Number of HAZOP deviations |
{iprMoyen} | Average RPN for the FMEA study |
{TABLE-APR} | Complete PHA scenario table |
{TABLE-AMDEC} | Complete failure-mode table |
{RISK-MATRIX} | Criticality matrix with scenarios plotted |